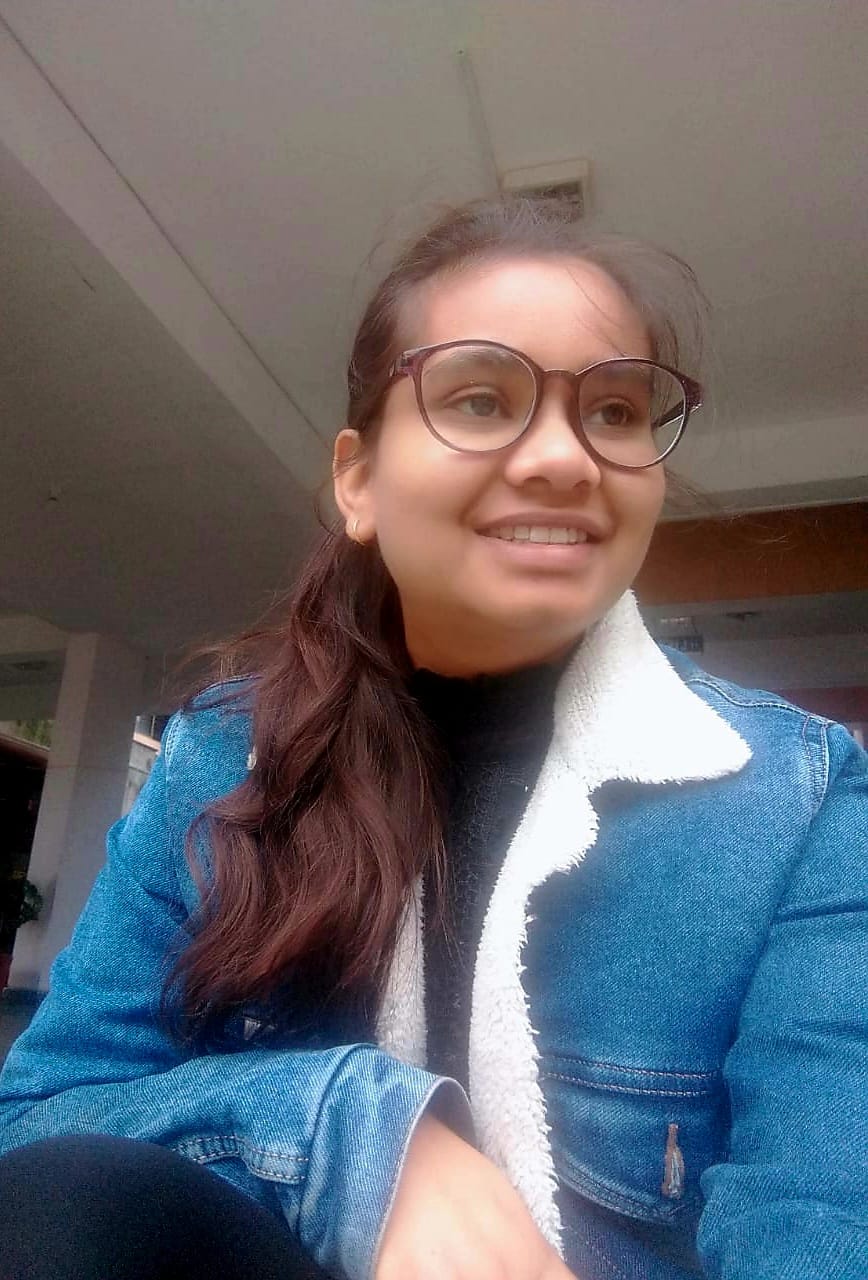
Final-year BTech student at IIITDM Jabalpur, specializing in Smart Manufacturing, with strong hands-on experience in data analytics, machine learning, and visualization tools. Proficient in Python, SQL, Excel, Power BI, and statistical techniques such as exploratory data analysis, feature engineering, and predictive modeling. Passionate about solving real-world problems by transforming raw data into meaningful insights that drive innovation and efficiency—especially within industrial and business environments.
0 + Projects completed
I have worked on diverse projects in business analysis, data analytics, and machine learning, applying tools such as Power BI, Tableau, Excel, and SQL to uncover insights and support decision-making. With strong proficiency in Python, PySpark, and data visualization libraries like Matplotlib and Seaborn, I have analyzed datasets across domains including retail, sports analytics, aviation, and app marketplaces. My experience spans end-to-end processes from data cleaning and preprocessing to building interactive dashboards and predictive models.
86%
Grade: 91.6%
Below are my some of the projects.
Analyzed 10,000+ flight records to identify factors affecting ticket prices. Applied EDA and feature engineering, handling missing values and encoding categories, which boosted model accuracy by 18%. The project highlights how data preparation enhances machine learning performance.
Analyzed 250,000+ Play Store app records to identify customer preferences, pricing trends, and demand patterns. Improved data quality by 95% through cleaning and feature engineering, enabling more accurate insights.
Created an interactive Power BI dashboard analyzing attendance data of 500+ employees, identifying seasonal trends that caused a 15% rise in absenteeism. Enabled HR teams to take timely action, leading to a 10% improvement in overall attendance.
Analyzed 1,000+ call center records using Excel to uncover trends in call duration, satisfaction scores, and agent performance, leading to a 12% boost in resolution efficiency. Visualized key insights with pivot tables, revealing 20% higher satisfaction on weekends, which helped optimize staffing and scheduling.
Conducted in-depth analysis of over 10 seasons of IPL data using Python and PySpark to identify performance trends, team win rates, and the impact of toss decisions. Evaluated player efficiency metrics and developed visual dashboards to present actionable insights, supporting data-driven strategies in sports analytics.
Analyzed 3,500+ retail transactions using SQL and Excel to uncover purchasing patterns, seasonal peaks, and top category performance. Built dashboards revealing 1.8× Q4 sales growth and 42% category share, driving recommendations to boost conversions by 20% and cut seasonal stockouts by 12%.
Below are the details to reach out to me!
Mathura, India